Total Software Units: 456,000
PS3: 23.3% (106,248)
PC: 22.7% (103,512)
PS2: 17.5% (79,800)
360: 15.3% (69,768)
Wii: 10.9% (49,704)
NDS: 6.5% (29,640)
PSP: 3.9% (17,784)
Total Software Value: €15,300,000
PS3: 31.4% (€4,804,200)
360: 20.2% (€3,090,600)
Wii: 16.3% (€2,493,900)
PC: 15.3% (€2,340,900)
PS2: 7.6% (€1,162,800)
NDS: 7.4% (€1,132,200)
PSP: 1.8% (€275,400)
FIGMA
Showing posts with label Finland. Show all posts
Showing posts with label Finland. Show all posts
Friday, 23 April 2010


Wednesday, 31 March 2010
Nordic Playstation Shipments
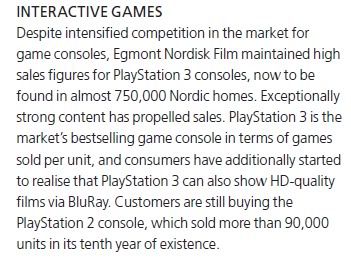
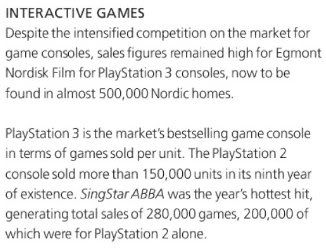
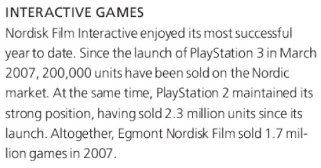
Egmont, parent company of Nordic Playstation distributor Nordisk Film has released it's 2009 Annual Report for the year ending December 31 2009.
2009 Hardware Shipments / LTD:
PS3: 250,000 / 750,000
PS2: 90,000 / 2,540,000
Nordisk Film 2009 Annual Report:

Nordisk Film 2008 Annual Report:

Nordisk Film 2007 Annual Report:

Egmont Annual Reports
2009 Hardware Shipments / LTD:
PS3: 250,000 / 750,000
PS2: 90,000 / 2,540,000
Nordisk Film 2009 Annual Report:
Nordisk Film 2008 Annual Report:
Nordisk Film 2007 Annual Report:
Egmont Annual Reports
Thursday, 4 February 2010
FIGMA (Finland) Sales Awards 2009
The following games passed the noted lifetime sales milestones in Finland during 2009:
Multi-Platinum (Multiple 20,000+):
[PS2] GTA: San Andreas - 123,745
[PS2] SingStar Legendat - 90,755
[PS2] SingStar SuomiRock - 90,593
[PC] World of Warcraft - 84,700
[PC] Counter-Strike: Source - 66,351
[WII] Wii Fit - 59,032
Platinum (20,000+):
[PS3] NHL 10 - 32,450
[PS2] SingStar SuomiPop - 31,490
[PC] The Sims 3 - 30,187
[WII] Mario Kart - 27,500
[NDS] New Super Mario Bros. - 25,766
[WII] Wii Sports Resort - 25,308
[360] NHL 10 - 22,750
[PC] Call of Duty 4 Modern Warfare - 22,667
[PS2] NHL 09 - 20,619
[PS3] SingStar SuomiPop - 20,069
[PC] Warcraft III Frozen Throne - 20,002
[PS2] Crash Bandicoot: Mind Over Mutant - 20,000
Gold (10,000+):
[WII] Wii Fit Plus - 18,899
[PS3] Call of Duty Modern Warfare 2 - 18,654
[PC] Call of Duty Modern Warfare 2 - 16,858
[360] Call of Duty Modern Warfare 2 - 16,387
[PS3] Call of Duty 4 Modern Warfare - 14,861
[NDS] Nintendogs Dalmatialainen - 13,441
[PS3] Uncharted 2: Among Thieves - 12,569
[360] Call of Duty 4 Modern Warfare - 12,568
[WII] New Super Mario Bros. - 11,401
[PS3] Call of Duty: World at War - 11,334
[PS3] Ratchet & Clank: A Crack in Time - 11,020
[WII] Super Smash Bros. Brawl - 10,805
[360] Grand Theft Auto: Episodes From Liberty City - 10,790
[PC] The Sims 3 Maailmanmatkaaja - 10,750
[PC] Call of Duty: World at War - 10,426
[NDS] Pokemon Pearl - 10,189
[360] Forza Motorsport 3 - 10,101
[360] Call of Duty: World at War - 10,017
[PS3] Buzz! Visailun Maailma - 10,011
[PS3] FIFA 10 - 10,000
[PS3] Need For Speed: Shift - 10,000
[PC] Dragon Age: Origins - 10,000
2009
2008
2007
2006
2005
2004
TOP 10 2000 - 2009:
01. [PS2] GTA: San Andreas (PAN Vision) - 123 745
02. [PC] The Sims 2 (Electronic Arts Finland Oy) - 119 188
03. [PS2] SingStar Legends (Oy Nordisk Film Ab) - 90 755
04. [PS2] SingStar Rock Finland (Oy Nordisk Film Ab) - 90 593
05. [PC] World of Warcraft (Activision-Blizzard) - 84 700
06. [PC] Counter-Strike: Source (Electronic Arts Finland Oy) - 66 351
07. [PS2] Sly Raccoon 3: Honor Among Thieves (Oy Nordisk Film Ab) - 59 375
08. [WII] Wii Fit (AMO Oy) - 59 032 AMO Oy 3 3 2008 2008
09. [PS2] Need for Speed: Most Wanted (Electronic Arts Finland Oy) - 58 761
10. [PC] Counter-Strike 1: Anthology (Electronic Arts Finland Oy) - 56 599
Multi-Platinum (Multiple 20,000+):
[PS2] GTA: San Andreas - 123,745
[PS2] SingStar Legendat - 90,755
[PS2] SingStar SuomiRock - 90,593
[PC] World of Warcraft - 84,700
[PC] Counter-Strike: Source - 66,351
[WII] Wii Fit - 59,032
Platinum (20,000+):
[PS3] NHL 10 - 32,450
[PS2] SingStar SuomiPop - 31,490
[PC] The Sims 3 - 30,187
[WII] Mario Kart - 27,500
[NDS] New Super Mario Bros. - 25,766
[WII] Wii Sports Resort - 25,308
[360] NHL 10 - 22,750
[PC] Call of Duty 4 Modern Warfare - 22,667
[PS2] NHL 09 - 20,619
[PS3] SingStar SuomiPop - 20,069
[PC] Warcraft III Frozen Throne - 20,002
[PS2] Crash Bandicoot: Mind Over Mutant - 20,000
Gold (10,000+):
[WII] Wii Fit Plus - 18,899
[PS3] Call of Duty Modern Warfare 2 - 18,654
[PC] Call of Duty Modern Warfare 2 - 16,858
[360] Call of Duty Modern Warfare 2 - 16,387
[PS3] Call of Duty 4 Modern Warfare - 14,861
[NDS] Nintendogs Dalmatialainen - 13,441
[PS3] Uncharted 2: Among Thieves - 12,569
[360] Call of Duty 4 Modern Warfare - 12,568
[WII] New Super Mario Bros. - 11,401
[PS3] Call of Duty: World at War - 11,334
[PS3] Ratchet & Clank: A Crack in Time - 11,020
[WII] Super Smash Bros. Brawl - 10,805
[360] Grand Theft Auto: Episodes From Liberty City - 10,790
[PC] The Sims 3 Maailmanmatkaaja - 10,750
[PC] Call of Duty: World at War - 10,426
[NDS] Pokemon Pearl - 10,189
[360] Forza Motorsport 3 - 10,101
[360] Call of Duty: World at War - 10,017
[PS3] Buzz! Visailun Maailma - 10,011
[PS3] FIFA 10 - 10,000
[PS3] Need For Speed: Shift - 10,000
[PC] Dragon Age: Origins - 10,000
2009
2008
2007
2006
2005
2004
TOP 10 2000 - 2009:
01. [PS2] GTA: San Andreas (PAN Vision) - 123 745
02. [PC] The Sims 2 (Electronic Arts Finland Oy) - 119 188
03. [PS2] SingStar Legends (Oy Nordisk Film Ab) - 90 755
04. [PS2] SingStar Rock Finland (Oy Nordisk Film Ab) - 90 593
05. [PC] World of Warcraft (Activision-Blizzard) - 84 700
06. [PC] Counter-Strike: Source (Electronic Arts Finland Oy) - 66 351
07. [PS2] Sly Raccoon 3: Honor Among Thieves (Oy Nordisk Film Ab) - 59 375
08. [WII] Wii Fit (AMO Oy) - 59 032 AMO Oy 3 3 2008 2008
09. [PS2] Need for Speed: Most Wanted (Electronic Arts Finland Oy) - 58 761
10. [PC] Counter-Strike 1: Anthology (Electronic Arts Finland Oy) - 56 599
Tuesday, 26 January 2010
Nordic-wide software chart on it's way
From MCV's Nordic Market Report (PDF, page 19).
However – despite the on-going challenges – the Nordic games market is growing up. Its retail sector has matured, with the likes of GAME and GameStop in the territory. Meanwhile, the industry’s trade bodies are working hard with governments and financial bodies, while an official Nordic-wide chart isn’t far away either.
“The Swedish trade body MDTS and the Nordic Game program are doing a great job with the political agenda,” says Nordic Games MD Pelle Lundborg.
“I am positive that there are less tough challenges ahead, and whatever they are, the industry is now grown up enough to deal with them – similar to how ELSPA in the UK have got very organised in dealing with issues.
“To get the financial industry more involved is still tough, but things started moving in the right direction here as well during 2009. A pan-Nordic reporting – similar to Chart-Track – is soon underway and is well needed.”
Nordic region market report
MCV's full Nordic Market Report can be read from page 19 of this PDF.
NORDIC MARKET OVERVIEW
Chris Stanton-Jones of emerging market specialists Catapult Business Solutions provides us with a detailed run-down of the Nordic video games market…
The Nordic games market is expected to be flat year-on-year. The first two quarters were the hardest and the MDTS (Sweden trade association) reported that in Sweden game sales were down five per cent in unit terms and 10 per cent down in value terms. Trading in Q3, however, was much improved and elevated the overall cumulative years performance.
The Danish games market appears to be achieving greater growth than the other territories. In the first seven months of 2009, Danish software sales rose three per cent year-on-year. By comparison, the Swedish software market for the period went up one per cent while sales fell one per cent in Norway.
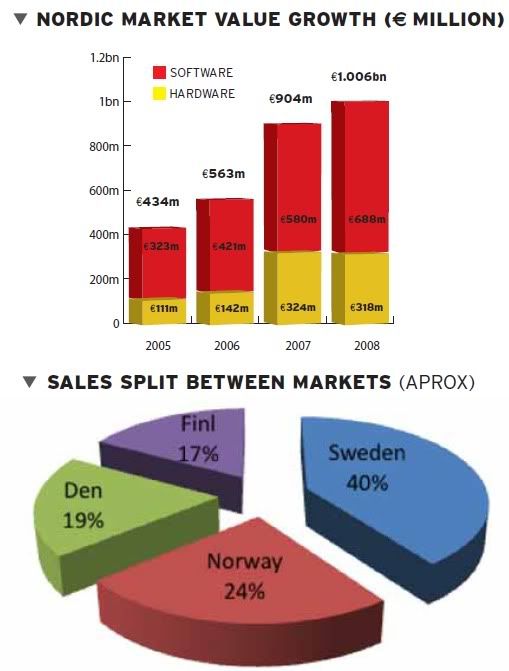
In terms of share by region, Sweden is the largest market, with about 40 per cent share, and Finland is the smallest with about 17 per cent.
In terms of hardware, after a slow start to 2009, PS3, Wii and Xbox 360 have all shown considerable growth and momentum since their price reductions.
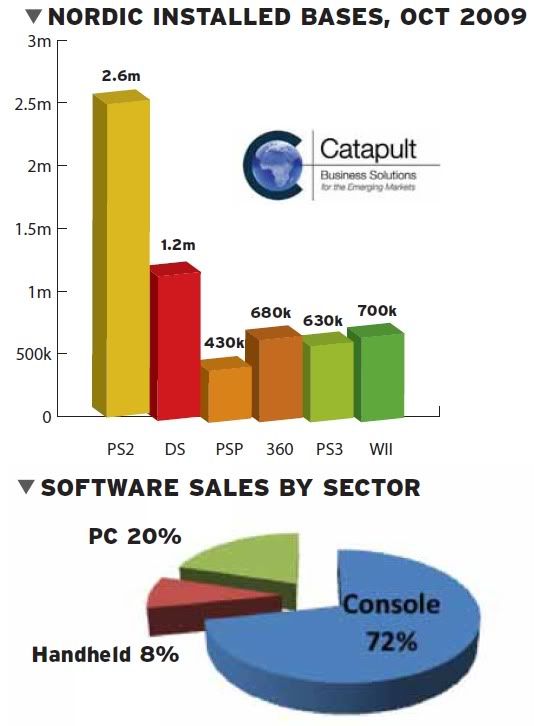
All formats are close both in terms of installed base and week-on-week sales. It will be a fascinating contest to see who might emerge as a leader. These three formats now dominate the software business with over 55 per cent of the market value.
The PC market is still large but no longer dominates the sector, and its value share is now down to 18 to 20 per cent. PlayStation 2 software sales are down dramatically year-on-year but still sizeable and outselling DS and PSP formats combined. DS is the largest selling console although it might be starting to reach its peak.
It is difficult to track the market properly with no official sell-through data in Norway and Finland. This should be a priority for the Nordic games industry to solve.
Last year there was no major change in the retail landscape although Media Markt – a relatively new entrant to the Nordic market – are reported as one of the chains that has increased their market share the most.
There has been no significant change in retail’s buying behaviour or terms with suppliers as a result of the financial crisis.
Catapult Business Solutions estimates for the Nordic market:


NORDIC MARKET OVERVIEW
Chris Stanton-Jones of emerging market specialists Catapult Business Solutions provides us with a detailed run-down of the Nordic video games market…
The Nordic games market is expected to be flat year-on-year. The first two quarters were the hardest and the MDTS (Sweden trade association) reported that in Sweden game sales were down five per cent in unit terms and 10 per cent down in value terms. Trading in Q3, however, was much improved and elevated the overall cumulative years performance.
The Danish games market appears to be achieving greater growth than the other territories. In the first seven months of 2009, Danish software sales rose three per cent year-on-year. By comparison, the Swedish software market for the period went up one per cent while sales fell one per cent in Norway.
In terms of share by region, Sweden is the largest market, with about 40 per cent share, and Finland is the smallest with about 17 per cent.
In terms of hardware, after a slow start to 2009, PS3, Wii and Xbox 360 have all shown considerable growth and momentum since their price reductions.
All formats are close both in terms of installed base and week-on-week sales. It will be a fascinating contest to see who might emerge as a leader. These three formats now dominate the software business with over 55 per cent of the market value.
The PC market is still large but no longer dominates the sector, and its value share is now down to 18 to 20 per cent. PlayStation 2 software sales are down dramatically year-on-year but still sizeable and outselling DS and PSP formats combined. DS is the largest selling console although it might be starting to reach its peak.
It is difficult to track the market properly with no official sell-through data in Norway and Finland. This should be a priority for the Nordic games industry to solve.
Last year there was no major change in the retail landscape although Media Markt – a relatively new entrant to the Nordic market – are reported as one of the chains that has increased their market share the most.
There has been no significant change in retail’s buying behaviour or terms with suppliers as a result of the financial crisis.
Catapult Business Solutions estimates for the Nordic market:
Sunday, 24 January 2010
Finland 2009
Total Software Units: 2,088,000 (2008: 2,326,000)
PS2: 25.2% (526,176)
PC: 20.9% (436,392)
PS3: 19.8% (413,424)
360: 13.8% (288,144)
WII: 11.8% (246,384)
NDS: 6.6% (137,808)
PSP: 1.9% (39,672)
Total Software Value: €75.4M (2008: €86.5M)
PS3: 27.1% (€20,433,400)
360: 18.6% (€14,024,400)
WII: 16.9% (€12,742,600)
PS2: 16.0% (€12,064,000)
PC: 13.7% (€10,329,800)
NDS: 6.2% (€4,674,800)
PSP: 1.5% (€1,131,000)
FIGMA
PS2: 25.2% (526,176)
PC: 20.9% (436,392)
PS3: 19.8% (413,424)
360: 13.8% (288,144)
WII: 11.8% (246,384)
NDS: 6.6% (137,808)
PSP: 1.9% (39,672)
Total Software Value: €75.4M (2008: €86.5M)
PS3: 27.1% (€20,433,400)
360: 18.6% (€14,024,400)
WII: 16.9% (€12,742,600)
PS2: 16.0% (€12,064,000)
PC: 13.7% (€10,329,800)
NDS: 6.2% (€4,674,800)
PSP: 1.5% (€1,131,000)
FIGMA
Friday, 30 October 2009
Finland Q1-Q3 2009
Total Software Units: 1,200,000 (2008: 1,300,000)
PS2: 28.2% (338,400)
PC: 23.5% (282,000)
PS3: 16.5% (198,000)
360: 13.5% (162,000)
WII: 10.3% (123,600)
NDS: 6.2% (74,400)
PSP: 1.8% (21,600)
Total Software Value: €41M (2008: €44.9M)
PS3: 23.2% (€9,512,000)
PS2: 19.6% (€8,036,000)
360: 18.8% (€7,708,000)
WII: 15.7% (€6,437,000)
PC: 15.3% (€6,273,000)
NDS: 6.1% (€2,501,000)
PSP: 1.3% (€533,000)
FIGMA
PS2: 28.2% (338,400)
PC: 23.5% (282,000)
PS3: 16.5% (198,000)
360: 13.5% (162,000)
WII: 10.3% (123,600)
NDS: 6.2% (74,400)
PSP: 1.8% (21,600)
Total Software Value: €41M (2008: €44.9M)
PS3: 23.2% (€9,512,000)
PS2: 19.6% (€8,036,000)
360: 18.8% (€7,708,000)
WII: 15.7% (€6,437,000)
PC: 15.3% (€6,273,000)
NDS: 6.1% (€2,501,000)
PSP: 1.3% (€533,000)
FIGMA
Tuesday, 21 July 2009
Finnish software market declines in H1 '09
Figures released by FIGMA show a decline in the Finnish software market through the first six months of 2009. Unit sales were down 8% from 888,000 in 2008 to 815,000 in 2009. Value was down 6% from €28.6m in 2008 to €27m in 2009.
Total Software Units: 815,000
PS2 - 30.9% (251,835)
PC - 26.1% (219,235)
PS3 - 15.1% (123,065)
360 - 11.8% (96,170)
Wii - 9.1% (74,165)
NDS - 5.5% (44,825)
PSP - 1.5% (12,225)
Total Software Value: €27m
PS2 - 21.8% (€5.886m)
PS3 - 21.1%(€5.697m)
PC - 17.8% (€4.806m)
360 - 16.5% (€4.445m)
Wii - 15.5% (€4.185m)
NDS - 6.2% (€1.674m)
PSP - 1.1% (€0.297m)
Total Software Units: 815,000
PS2 - 30.9% (251,835)
PC - 26.1% (219,235)
PS3 - 15.1% (123,065)
360 - 11.8% (96,170)
Wii - 9.1% (74,165)
NDS - 5.5% (44,825)
PSP - 1.5% (12,225)
Total Software Value: €27m
PS2 - 21.8% (€5.886m)
PS3 - 21.1%(€5.697m)
PC - 17.8% (€4.806m)
360 - 16.5% (€4.445m)
Wii - 15.5% (€4.185m)
NDS - 6.2% (€1.674m)
PSP - 1.1% (€0.297m)
Subscribe to:
Posts (Atom)
