Showing posts with label US. Show all posts

Saturday, 31 July 2010

NPD April & May 2010 Full Top 10s

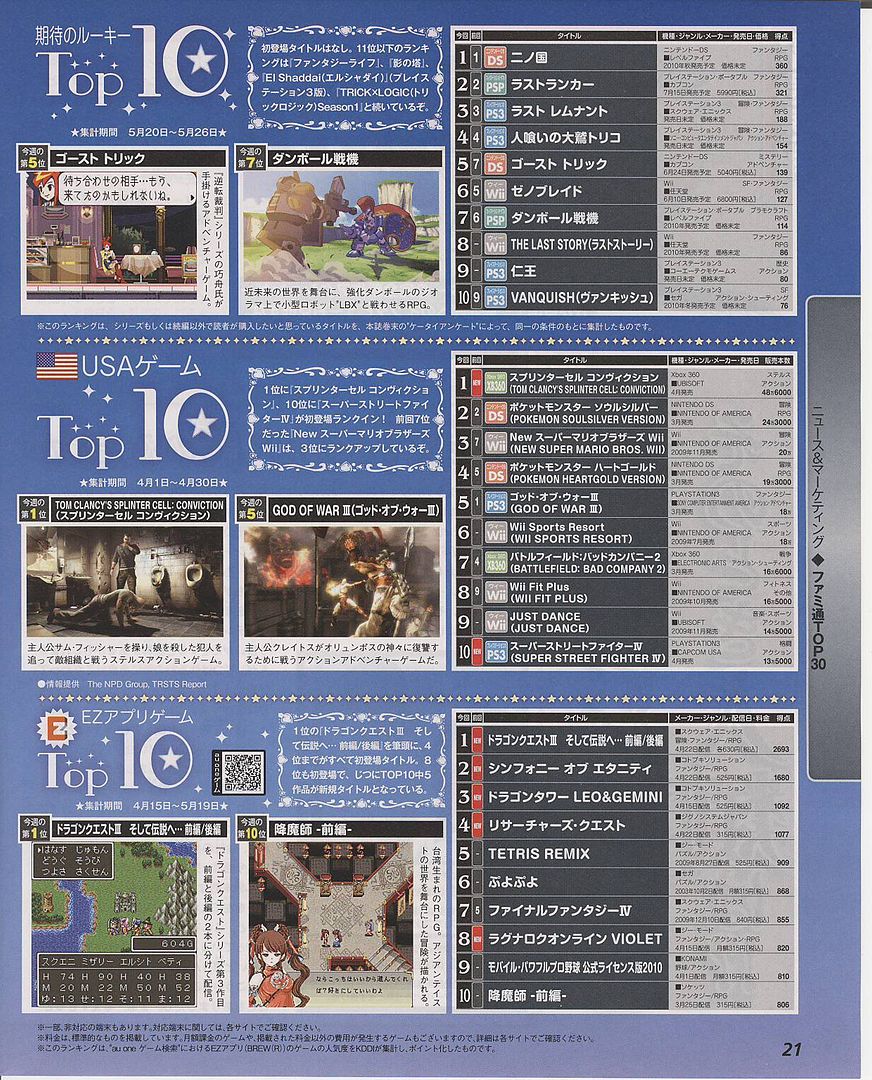
NPD Top 10 numbers live on ... in Famitsu;

May 2010:

01. [360] Red Dead Redemption (Take 2) - 945,900 / NEW
02. [PS3] Red Dead Redemption (Take 2) - 567,100 / NEW
03. [WII] Super Mario Galaxy 2 (Nintendo) - 563,900 / NEW
04. [360] UFC 2010: Undisputed (THQ) - 221,100 / NEW
05. [PS3] UFC 2010: Undisputed (THQ) - 192,300 / NEW
06. [WII] Wii Fit Plus (Nintendo) - 185,000
07. [WII] New Super Mario Bros. Wii (Nintendo) - 184,000 / 6,264,000
08. [360] Alan Wake (Microsoft) - 145,000 / NEW
09. [NDS] Pokemon SoulSilver (Nintendo) - 141,000 / 1,403,900
10. [360] Skate 3 (Electronic Arts) - 133,000 / NEW

April 2010:

01. [360] Tom Clancy's Splinter Cell: Conviction (Ubisoft) - 486,100 / NEW
02. [NDS] Pokemon SoulSilver (Nintendo) - 242,900 / 1,262,900
03. [WII] New Super Mario Bros. Wii (Nintendo) - 200,300 / 6,080,000
04. [NDS] Pokemon HeartGold (Nintendo) - 192,600 / 953,800
05. [PS3] God of War III PS3 (Sony) - 180,300 / 1,280,300
06. [WII] Wii Sports Resort (Nintendo) - 180,000
07. [360] Battlefield Bad Company 2 (Electronic Arts) - 166,000 / 991,500
08. [WII] Wii Fit Plus (Nintendo) - 165,000
09. [WII] Just Dance (Ubisoft) - 145,000
10. [PS3] Super Street Fighter IV (Capcom) - 135,000 / NEW


Saturday, 8 May 2010

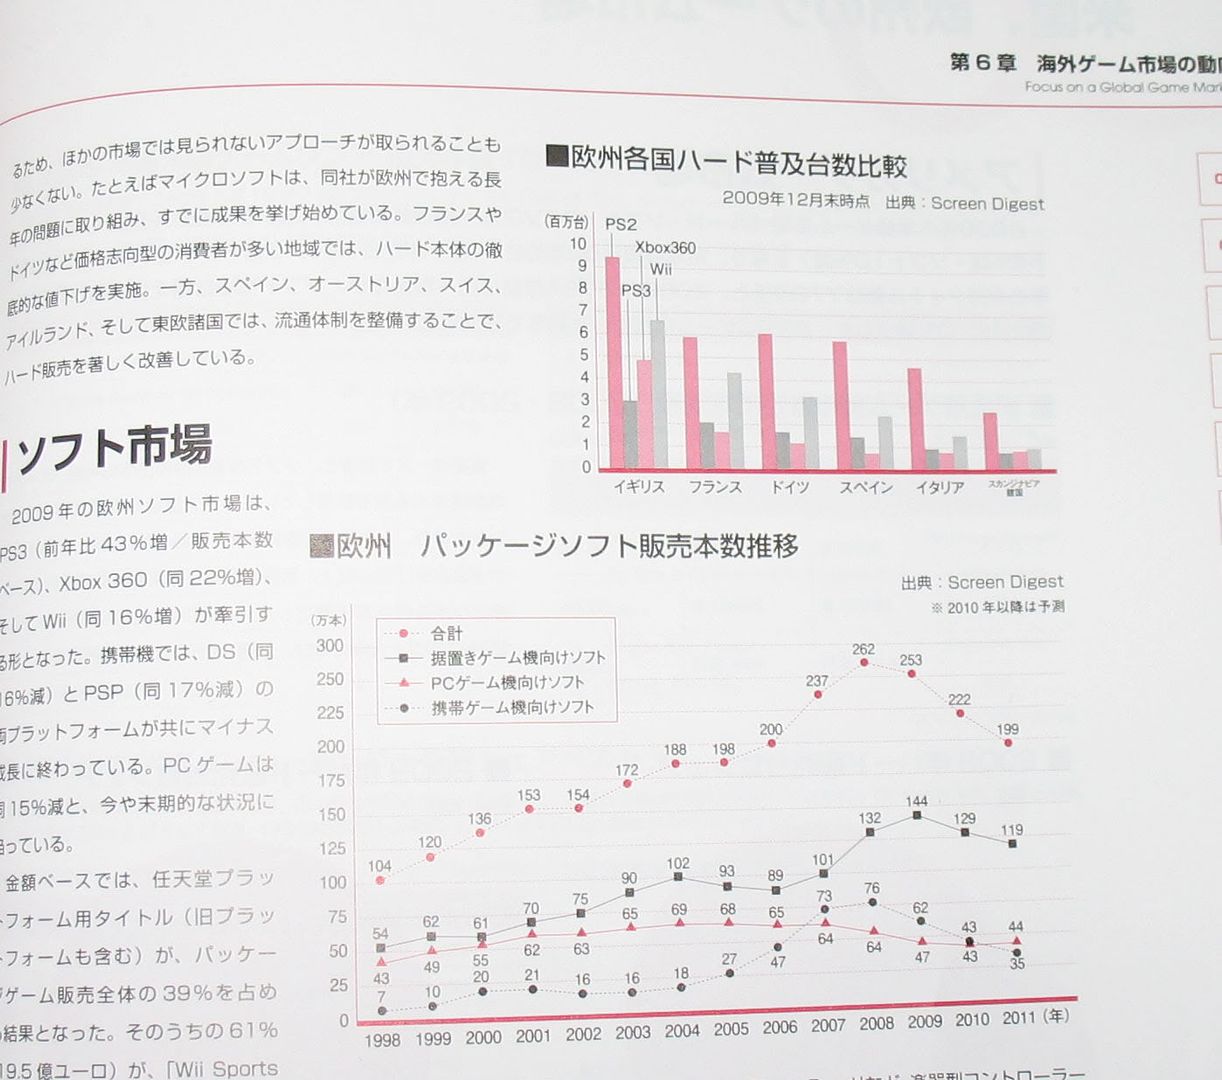
European 2010 Hardware and Software Sales

From Nintendo's latest Financial Results Briefing:


"Pixel Count";

2010 European* Hardware Unit Sales:

WK: Wii / PS3 / 360
01. 208,600 / 129,700 / 84,700
02. 97,500 / 66,100 / 53,400
03. 83,900 / 55,100 / 44,100
04. 86,400 / 59,300 / 48,300
05. 77,100 / 55,100 / 43,200
06. 81,400 / 54,200 / 44,100
07. 78,000 / 46,600 / 44,100
08. 80,500 / 55,500 / 39,000
09. 74,600 / 55,500 / 30,500
10. 64,000 / 55,500 / 37,200
11. 64,000 / 55,500 / 31,400
12. 74,600 / 46,600 / 29,700
13. 81,800 / 51,700 / 40,300
14. 64,400 / 41,500 / 30,100
15. 58,500 / 39,800 / 28,000
16. 55,900 / 38,100 / 26,300
TT: 1,331,200 / 905,800 / 654,400

*UK, France, Germany, Italy, Spain, Netherlands, Belgium

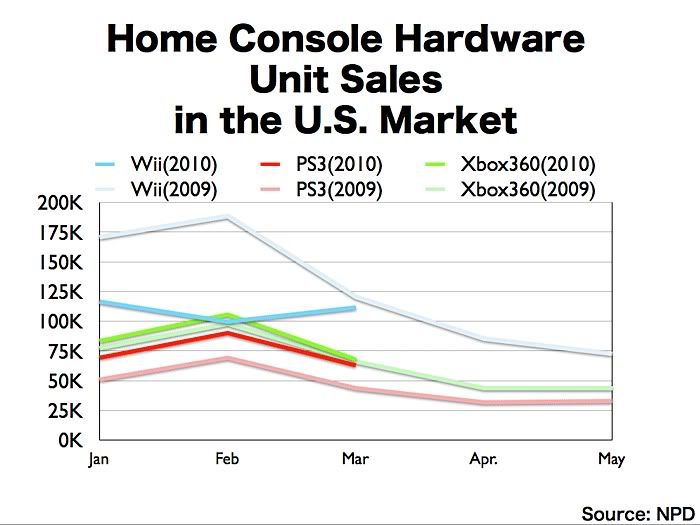
For comparison here are US sales through March (Week 13):


2010 US Hardware Unit Sales:

Mon: Wii / PS3 / 360
Jan: 465,800 / 276,900 / 332,800
Feb: 397,900 / 360,100 / 422,000
Mar: 557,500 / 313,900 / 338,400
TTL: 1,421,200 / 950,900 / 1,093,000

And Japan:


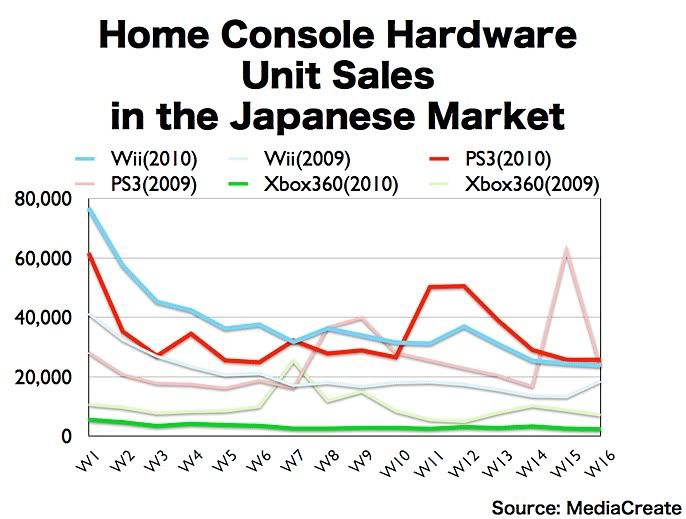
2010 Japanese Hardware Unit Sales:

WK: Wii / PS3 / 360
01. 76,772 / 61,591 / 5,461
02. 57,349 / 35,156 / 4,622
03. 45,167 / 26,966 / 3,343
04. 42,309 / 34,431 / 4,089
05. 36,149 / 25,450 / 3,651
06. 37,501 / 24,811 / 3,428
07. 31,652 / 32,130 / 2,453
08. 36,241 / 27,763 / 2,510
09. 33,880 / 28,824 / 2,764
10. 31,460 / 26,481 / 2,668
11. 31,101 / 50,164 / 2,419
12. 36,849 / 48,323 / 3,002
13. 30,938 / 38,877 / 2,676
14. 25,345 / 28,973 / 3,218
15. 24,344 / 25,590 / 2,442
16. 23,691 / 25,629 / 2,214
TT: 600,748 / 543,284 / 50,960

2010 Total EU*, JP*, & US** Hardware Unit Sales:
Wii: 3,353,148
PS3: 2,399,984
360: 1,798,360

*Weeks 1-16, Europe = UK, France, Germany, Italy, Spain, Netherlands, Belgium
** Weeks 1-13

A better comparison will be available when NPD release US April data next week, then JP & US will be weeks 1-17, and EU will be weeks 1-16.

2010 European Software Sales*


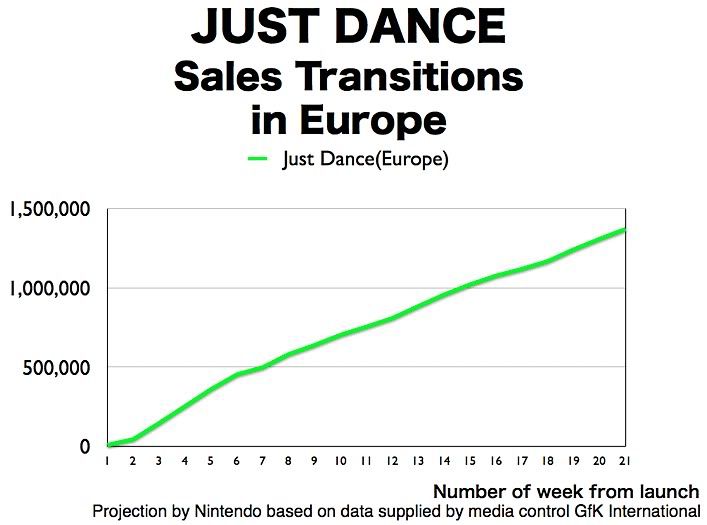
It's possible to "pixel count" Just Dance Sales;


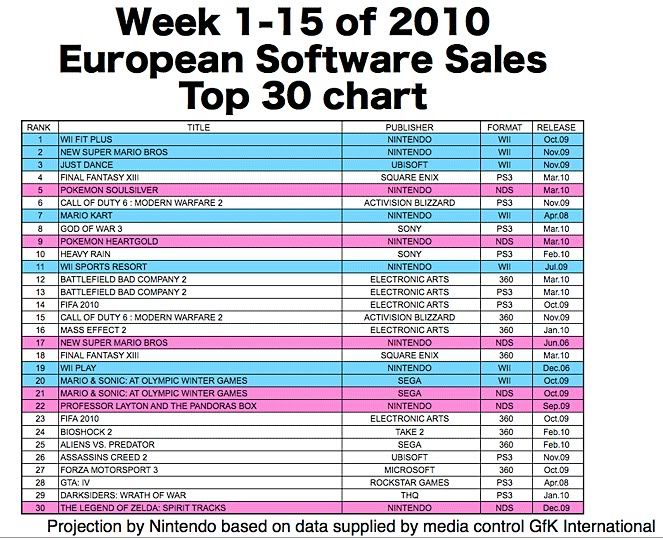
Europe* Weeks 1-15 2010:

Top 30:
01. [WII] Wii Fit Plus (Nintendo)
02. [WII] New Super Mario Bros. (Nintendo)
03. [WII] Just Dance (Ubisoft) - ~890,000 / ~1,390,000
04. [PS3] Final Fantasy XIII (Square Enix)
05. [NDS] Pokemon Soulsilver (Nintendo)
06. [PS3] Call of Duty: Modern Warfare 2 (Activision)
07. [WII] Mario Kart Wii (Nintendo)
08. [PS3] God of War III (Sony)
09. [NDS] Pokemon Heartgold (Nintendo)
10. [PS3] Heavy Rain (Sony)
11. [WII] Wii Sports Resort (Nintendo)
12. [360] Battlefield: Bad Company 2 (EA)
13. [PS3] Battlefield: Bad Company 2 (EA)
14. [PS3] FIFA 10 (EA)
15. [360] Call of Duty: Modern Warfare 2 (Activision)
16. [360] Mass Effect 2 (EA)
17. [NDS] New Super Mario Bros. (Nintendo)
18. [360] Final Fantasy XIII (Square Enix)
19. [WII] Wii Play (Nintendo)
20. [WII] Mario & Sonic at the Winter Olympic Games (Sega)
21. [NDS] Mario & Sonic at the Winter Olympic Games (Sega)
22. [NDS] Professor Layton and the Pandoras Box (Nintendo)
23. [360] FIFA 10 (EA)
24. [360] Biosock 2 (Take 2)
25. [360] Aliens Vs Predator (Sega)
26. [PS3] Assassin's Creed 2 (Ubisoft)
27. [360] Forza Motorsport 3 (Microsoft)
28. [PS3] Grand Theft Auto IV (Rockstar Games)
29. [PS3] Darksiders: Wrath of War (THQ)
30. [NDS] The Legend of Zelda: Spirit Tracks (Nintendo)

*Europe = UK, France, Germany, Italy, Spain, Netherlands, Belgium

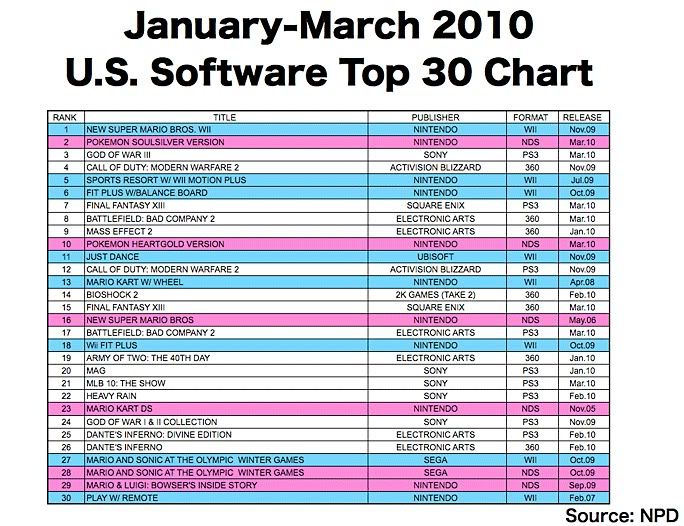
Here's the US Top 30:


Again, it's possible to "pixel count" Just Dance sales;

Dec: ~380,000
Jan: 191,900
Feb: 275,400
Mar: ~240,000


This chart separates SKU's, I've included available YTD sales figures through March, however some of these (such as God of War III) are for combined SKUs.

US Jan - Mar 2010:

Top 30:
01. [WII] New Super Mario Bros. (Nintendo) - 1,669,700 / 5,879,700
02. [NDS] Pokemon Soulsilver Version (Nintendo) - 1,020,000 / NEW
03. [PS3] God of War III (Sony) - 1,100,000* / NEW
04. [360] Call of Duty: Modern Warfare 2 (Activision)
05. [WII] Wii Sports Resort (Nintendo)
06. [WII] Wii Fit Plus W/Balance Board (Nintendo)
07. [PS3] Final Fantasy XIII (Square Enix) - 828,200 / NEW
08. [360] Battlefield: Bad Company 2 (EA) - 825,500 / NEW
09. [360] Mass Effect 2 (EA)
10. [NDS] Pokemon Heartgold Version (Nintendo) - 761,200 / NEW
11. [WII] Just Dance (Ubisoft) - ~710,000 / ~1,090,000
12. [PS3] Call of Duty: Modern Warfare 2 (Activision)
13. [WII] Mario Kart Wii (Nintendo)
14. [360] Biosock 2 (Take 2)
15. [360] Final Fantasy XIII (Square Enix) - 493,900 / NEW
16. [NDS] New Super Mario Bros. (Nintendo)
17. [PS3] Battlefield: Bad Company 2 (EA) - 451,200 / NEW
18. [WII] Wii Fit Plus (Nintendo)
19. [360] Army of Two: The 40th Day (EA)
20. [PS3] MAG (Sony)
21. [PS3] MLB 10: The Show (Sony) - 349,200 / NEW
22. [PS3] Heavy Rain (Sony)
23. [NDS] Mario Kart DS (Nintendo)
24. [PS3] God of War Collection (Sony)
25. [PS3] Dante's Inferno (EA)
26. [360] Dante's Inferno (EA)
27. [WII] Mario & Sonic at the Winter Olympic Games (Sega)
28. [NDS] Mario & Sonic at the Winter Olympic Games (Sega)
29. [NDS] Mario & Luigi: Bowser's Inside Story (Nintendo)
30. [WII] Wii Play (Nintendo)

*includes CE, GOTY editions, bundles, etc. but not those bundled with hardware

Friday, 5 March 2010

BlazBlue sells 350,000 in North America

I don't usually post shipments for individual titles, but will make an exception for the excellent "BlazBlue: Calamity Trigger", which is said by this week's MCV (pg 8) to have sold 350,000 units in North America.

In Japan the sell through is over 85K according to Famitsu, but as there was also an Asian release I'd guess it's shipped somewhere around 100K in the region, bringing total pre-PAL release shipments to somewhere around 450,000. The budget re-release comes out next week, so it has a chance to add a few more sales to that.

The PAL version releases March 19th in the UK, the same week as God of War III (PS3), and the week after Final Fantasy XIII (360, PS3), Samurai Showdown Sen (360), and Yakuza 3 (PS3). With it also launching 9 months after NA and Asia, and just 3 months before the already announced upgraded "BlazBlue: Continuum Shift" releases in Japan I don't think it's possible for UK publisher Zen United to be releasing it at a worse time. Still, they expect it to make the top 3 of the PS3 and Xbox 360 charts in the UK, so we'll see.

Thursday, 11 February 2010

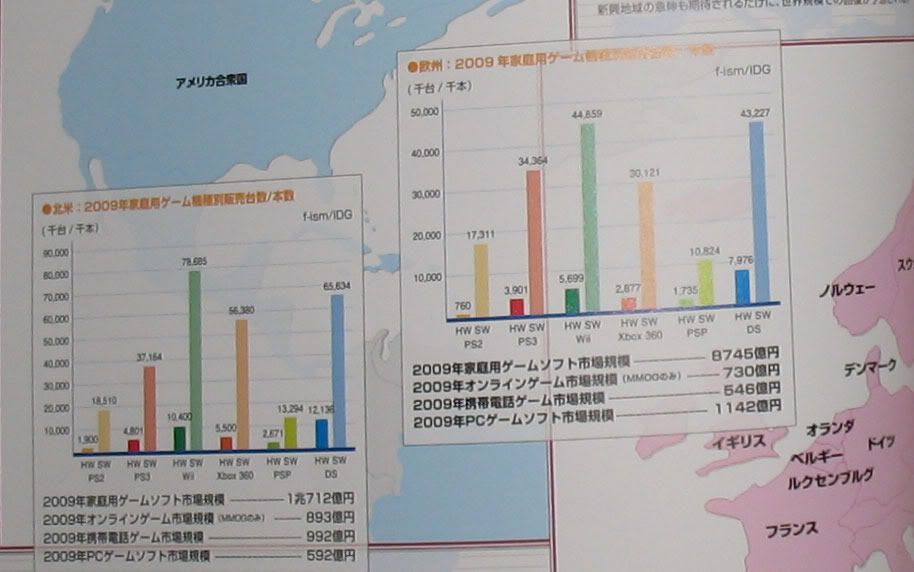
EU (GfK) + US (NPD) Hardware Sales

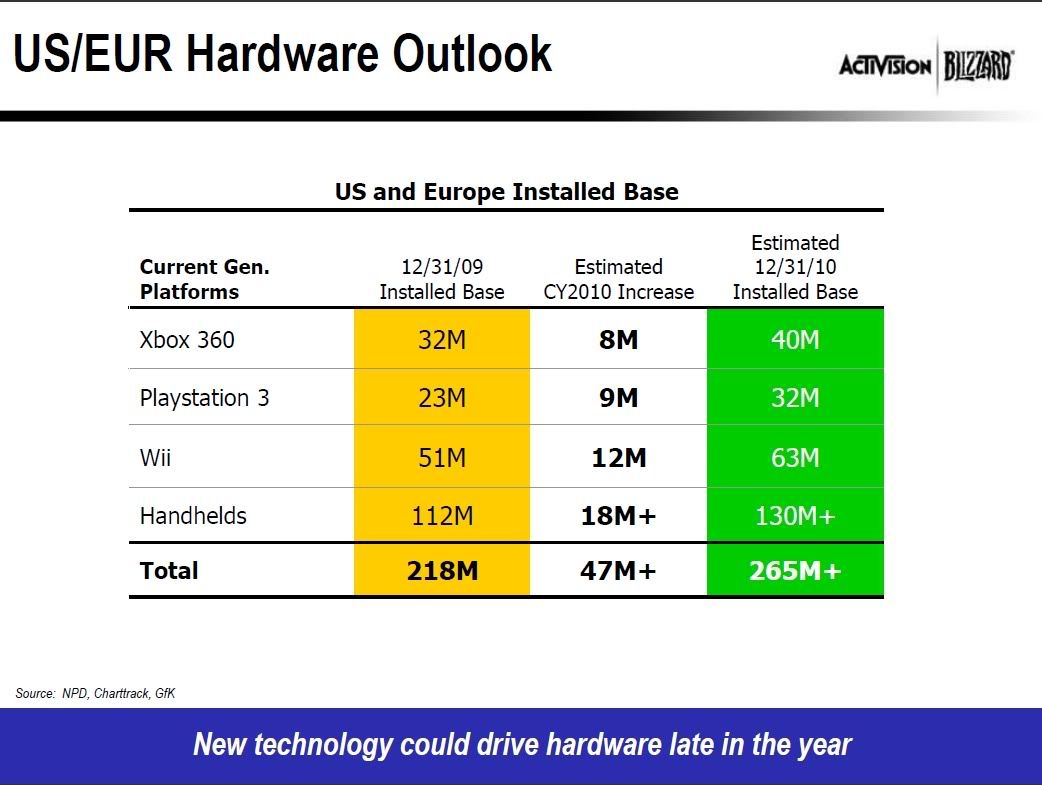
Activision have posted total hardware sales for US and Europe through 2009 citing NPD & GfK as sources.

Calculating European sales by deducting US sales gives:

US (NPD):
Wii: 27.1m
360: 18.6m
PS3: 11.1m

EU (GfK):
Wii: 23.9m
360: 13.4m
PS3: 11.9m

However it's unclear exactly which countries are included in Europe, and whether Canada is included with US or not. Although Eastern Europe, Finland, and Norway can safely be exlcuded as GfK don't track hardware sales in these regions.

Friday, 5 February 2010

Top Global Markets 2009 Report

2009 VIDEO GAME SOFTWARE SALES ACROSS TOP GLOBAL MARKETS EXPERIENCE DECLINES FOR CONSOLE AND PORTABLE PLATFORMS
Overall Sales in United States, United Kingdom and Japanese Markets Experience Annual Decline of 8 Percent

NEW YORK, TOKYO, LONDON, February 3, 2010 - According to recent findings from Top Global Markets, an integrated monthly report from leading providers of consumer and retail information in the video games industry, The NPD Group, GfK Chart-Track Limited and Enterbrain, Inc., combined video game software unit sales across the world’s three largest games markets experienced a decline of 8 percent in calendar year 2009* (Jan.-Dec.), totaling 379.3 million units.

The declines were more modest in Japan, which experienced a 2 percent decline in software units (5 percent decline in console software and a 1 percent decline in portable game software). The United States and UK saw respective declines of 7 percent and 14 percent. In the U.S., console and portable software experienced respective declines of 7 percent and 8 percent, while UK units saw respective declines of 6 percent and 25 percent.

Continuing the trend from 2008, the overall gaming software market in 2009 declined in large part due to the shrinking PlayStation 2 software market, which experienced a 57 percent decrease across the top global markets in 2009 based on units (U.S. -56 percent; UK -67 percent; Japan -55 percent).

Japan
“Japan's 2009 game software market was blessed with a string of Nintendo DS software hits during the period, including the trio of double-million-plus sellers, ‘Dragon Quest IX: Hoshizora no Mamoribito,’ ‘Pocket Monster Heart Gold/Soul Silver,’ and the year's most successful non-sequel, ‘Tomodachi Collection,’ which sold 2 million units,” said Mitsunobu Uwatoko, manager of global marketing, Enterbrain, Inc. “Moreover, ‘Final Fantasy XIII,’ ‘Wii Sports Resort,’ and ‘Wii Fit Plus,’ sold over a million each on top of the long-awaited ‘New Super Mario Bros. Wii,’ which sold over 2.4 million during its first month at retail.

However, these titles could not manage to recover the losses experienced during the first half of the year, thus the annual total sales was slightly down.”

United Kingdom
“For the UK videogame home console software market it is clear that current generation systems suffered slight negative growth overall in 2009, even though PS3 and 360 both enjoyed record volume (and value) software sales for the year, and were the only formats to exhibit positive growth over 2008,” said Dorian Bloch, Business Group Director, GfK Chart-Track Limited. “Growth on these platforms did not manage to offset the steep decline in PS2 software units (-67%), which in real terms was close to a decline of 4 million units. Also, the incredible performance exhibited by Nintendo's Wii in 2008 meant that Wii units fell back 10 percent, although remained the number one format in terms of units sold in 2009.

Within the portable market, it is clear that this is the reason for the overall console software decline. Nintendo DS volume (and value) sales in 2008 reached a high point brought about by massive, record-breaking DS Lite sales, and the corresponding sales of hit titles such as 'Dr Kawashima,' 'Mario & Sonic at the Olympics,' 'New Super Mario,' and 'Mario Kart DS.' Rolling on to 2009 saw much lower DS hardware sell-through and no new must-have DS titles at the top of the charts, apart from 'Professor Layton and Pandora's Box.' Sony’s PSP suffered a similar fate, with few must-have titles arriving in 2009, and a continued decline in PSP hardware sales, ever since the sweet spot achieved in 2006 with the original PSP.”

United States
“Looking at software sales performance, video game software unit sales declined seven percent for all of 2009. Still, while year-over-year comparisons show declines, the industry is still boasting significant volumes that were unseen before 2008,” said Anita Frazier, industry analyst, The NPD Group. “With the huge investment needed to produce software for this generation’s consoles, many publishers talk about releasing fewer titles each year, which will allow their teams to better focus on maximizing the success of each title. The theory is that this will produce more high- quality games resulting in better sales. However, the year-end data from 2009 shows us that the number of titles entering the market is still growing with 778 new titles released in 2009, up from the 764 in 2008.

So, while there has been no noticeable slow down in the number of titles launched each year, we do see some evidence of a converse relationship between the number of titles launched and the average unit sales of a title. When looking back at the past seven years, we see that 2004 had the lowest number of titles launched, yet the highest average unit sales. On the other hand, 2009 had the most titles launched and average unit sales were lower than they’ve been since 2005.”


Jan - Dec 2009
Jul - Sep 2009
Jan - Dec 2008
Jul - Sep 2008
Jan - Jul 2008

It should be noted that Chart-Track cover an estimated 90% of UK retail, they do not extrapolate to 100% of the market in their reports, and neither do ELSPA with their Sales Awards, or the monthly top ten charts published in Famitsu. However, in the Top Global Market reports UK sales are extrapolated with a simple 90% - 100% formula to bring them into line with the 100% extrapolated Japan and US figures.

Multiplying the UK sales for Wii Sports Resort and Wii Fit Plus by 0.9 gives the non-extrapolated totals of 1.34M and 871K respectively, which matches perfectly with the monthly UK charts published in Famitsu.

As I previously didn't have exact non-extrapolated UK lifetime figures for Wii Fit and New Super Mario Bros. through December, I've now updated the UK LTD Charts by Platform with the above figures (multiplied by 0.9) for these two games.

Monday, 9 November 2009

Top Global Markets Q3 2009 Report

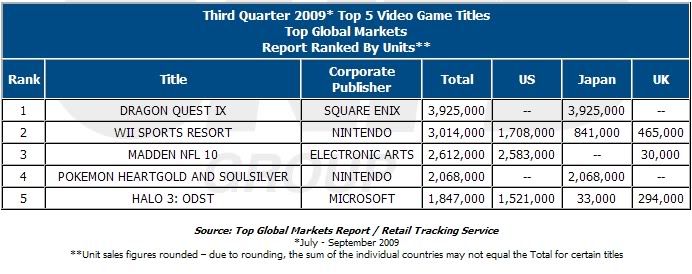
After an absence since 2008 Top Global Markets have issued a press release for the third quarter of 2009;

THIRD QUARTER 2009 SALES RESULTS FROM TOP GLOBAL VIDEO GAMES SOFTWARE MARKETS RELEASED
Japan Experiences Double-Digit Growth While United States and United Kingdom Decline

NEW YORK, TOKYO, LONDON, November 5, 2009 - According to recent findings from Top Global Markets, an integrated monthly report from leading providers of consumer and retail information in the video games industry, The NPD Group, GfK Chart-Track Limited and Enterbrain, Inc., combined video game software unit sales across the world’s three largest games markets experienced a decline of 6 percent during third-quarter (Q3) 2009 (July-September).

The Japanese software market saw unit sales increase by 15 percent vs. the 20 percent decline it experienced during the same time period in 2008. Console software and portable software saw positive unit growth in Japan, with respective increases of 7 percent and 19 percent. However, year-to-date (YTD) sales for Japan’s software market experienced a 9 percent decline.

With a decline of 19 percent, the United Kingdom experienced the largest aggregate drop in unit sales, followed by United States’ 9 percent decline. UK portable game software experienced a loss in unit sales of 34 percent, followed by console software with a decline of 12 percent. In the United States, console software and portable game software experienced declines of 8 percent and 14 percent, respectively.

Year-to-date unit sales in the United States and the United Kingdom experienced declines in both console software and portable game software, with total unit sales for the United States declining 8 percent, and United Kingdom unit sales declining by 13 percent.


Jul - Sep 2009
Jan - Dec 2008
Jul - Sep 2008
Jan - Jul 2008

It's worth noting that whilst Japan and UK have weekly sales reports, US only has monthly reports. Whilst Chart-Track's September ended September 26, NPD's ended a week later on October 03. Therefore the Top Global Market Report runs through October 03 to accomodate NPD's monthly reports. This does create a slight anomaly though, as Famitsu's Japanese reports runs through Sundays, as opposed to NPD's and Chart-Track's which run through Saturdays. This means the Japanese figures are actually through October 04 whilst UK and US figures are through October 03.

Another point to note is that whilst Chart-Track cover an estimated 90% of UK retail, they do not extrapolate to 100% of the market in their reports, and neither do ELSPA with their Sales Awards, or the monthly top ten charts published in Famitsu. However, in the Top Global Market reports UK sales are extrapolated with a simple 90% - 100% formula to bring them into line with the 100% extrapolated Japan and US figures.

These two points explain why Halo: ODST is listed at 294,000 in the UK through September in the Top Global Markets Report here, but only 212,000 in ELSPA's September top ten published in Famitsu. Halo: ODST's first two week's are covered in TGM's September, but only it's first week is covered in C-T's September.

To reconcile these two figures we need to add the second week of Halo: ODST's sales to it's first week sales. Fortunately Chart-Track tell us that Halo: ODST's second week sales were 25% of it's first, or 53,000. We then need to extrapolate the 265,000 total to 100% of the market from the 90% coverage by dividing by 0.9, this brings us to the 294,000 reported above. Or in other words;

(212 + (212 x .25)) / .9 = 294.444444

Tuesday, 3 November 2009

Japanese, North American, and Western European software and hardware unit sales 2008


PDF

Whilst the chart only says United States when adding up Famitsu Japanese, GfK European, and NPD US hardware unit sales the totals come up a bit short of the totals posted above, however, once Canadian NPD sales are included the totals match almost perfectly once rounding errors are taken into account. Therefore I'm fairly confident that the above chart also includes Canada along with the US.

Comparison of individual region totals to Famitsu White Paper totals:


Deducting European and Japanese figures from Famitsu White Paper totals leaves us with more accurate North American hardware sales:


Doing the same with software sales gives the NPD software units by platform figures, which I haven't seen published before: