THIRD QUARTER 2009 SALES RESULTS FROM TOP GLOBAL VIDEO GAMES SOFTWARE MARKETS RELEASED
Japan Experiences Double-Digit Growth While United States and United Kingdom Decline
NEW YORK, TOKYO, LONDON, November 5, 2009 - According to recent findings from Top Global Markets, an integrated monthly report from leading providers of consumer and retail information in the video games industry, The NPD Group, GfK Chart-Track Limited and Enterbrain, Inc., combined video game software unit sales across the world’s three largest games markets experienced a decline of 6 percent during third-quarter (Q3) 2009 (July-September).
The Japanese software market saw unit sales increase by 15 percent vs. the 20 percent decline it experienced during the same time period in 2008. Console software and portable software saw positive unit growth in Japan, with respective increases of 7 percent and 19 percent. However, year-to-date (YTD) sales for Japan’s software market experienced a 9 percent decline.
With a decline of 19 percent, the United Kingdom experienced the largest aggregate drop in unit sales, followed by United States’ 9 percent decline. UK portable game software experienced a loss in unit sales of 34 percent, followed by console software with a decline of 12 percent. In the United States, console software and portable game software experienced declines of 8 percent and 14 percent, respectively.
Year-to-date unit sales in the United States and the United Kingdom experienced declines in both console software and portable game software, with total unit sales for the United States declining 8 percent, and United Kingdom unit sales declining by 13 percent.
Jul - Sep 2009
Jan - Dec 2008
Jul - Sep 2008
Jan - Jul 2008
It's worth noting that whilst Japan and UK have weekly sales reports, US only has monthly reports. Whilst Chart-Track's September ended September 26, NPD's ended a week later on October 03. Therefore the Top Global Market Report runs through October 03 to accomodate NPD's monthly reports. This does create a slight anomaly though, as Famitsu's Japanese reports runs through Sundays, as opposed to NPD's and Chart-Track's which run through Saturdays. This means the Japanese figures are actually through October 04 whilst UK and US figures are through October 03.
Another point to note is that whilst Chart-Track cover an estimated 90% of UK retail, they do not extrapolate to 100% of the market in their reports, and neither do ELSPA with their Sales Awards, or the monthly top ten charts published in Famitsu. However, in the Top Global Market reports UK sales are extrapolated with a simple 90% - 100% formula to bring them into line with the 100% extrapolated Japan and US figures.
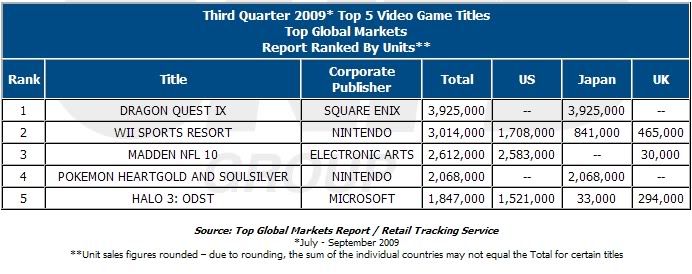
These two points explain why Halo: ODST is listed at 294,000 in the UK through September in the Top Global Markets Report here, but only 212,000 in ELSPA's September top ten published in Famitsu. Halo: ODST's first two week's are covered in TGM's September, but only it's first week is covered in C-T's September.
To reconcile these two figures we need to add the second week of Halo: ODST's sales to it's first week sales. Fortunately Chart-Track tell us that Halo: ODST's second week sales were 25% of it's first, or 53,000. We then need to extrapolate the 265,000 total to 100% of the market from the 90% coverage by dividing by 0.9, this brings us to the 294,000 reported above. Or in other words;
(212 + (212 x .25)) / .9 = 294.444444
No comments:
Post a Comment